Performance Efficiency Variations in NBA Athletes During Back-to-Back Contests Within Tight Scheduling Windows
Written by Jakob Bennett · Sep 17, 2026
Performance Efficiency Variations in NBA Athletes During Back-to-Back Contests Within Tight Scheduling Windows
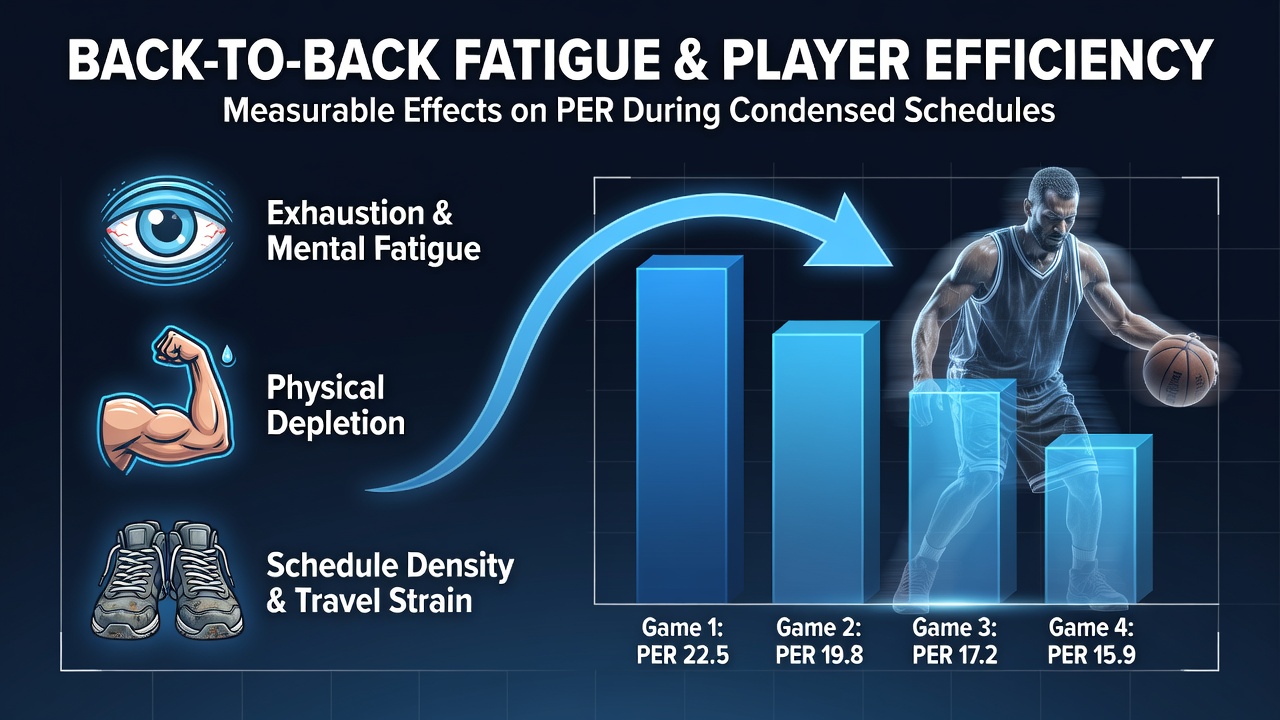
Back-to-back games in the NBA create measurable shifts in player output, and researchers track these changes through specific fatigue indicators that correlate with drops in efficiency ratings during periods of compressed scheduling. Data from recent seasons shows that players logging heavy minutes in successive contests often exhibit declines in key metrics such as points per possession, assist-to-turnover ratios, and defensive stop percentages, while condensed calendars amplify these patterns across entire rosters.
Fatigue Indicators Identified in Successive Games
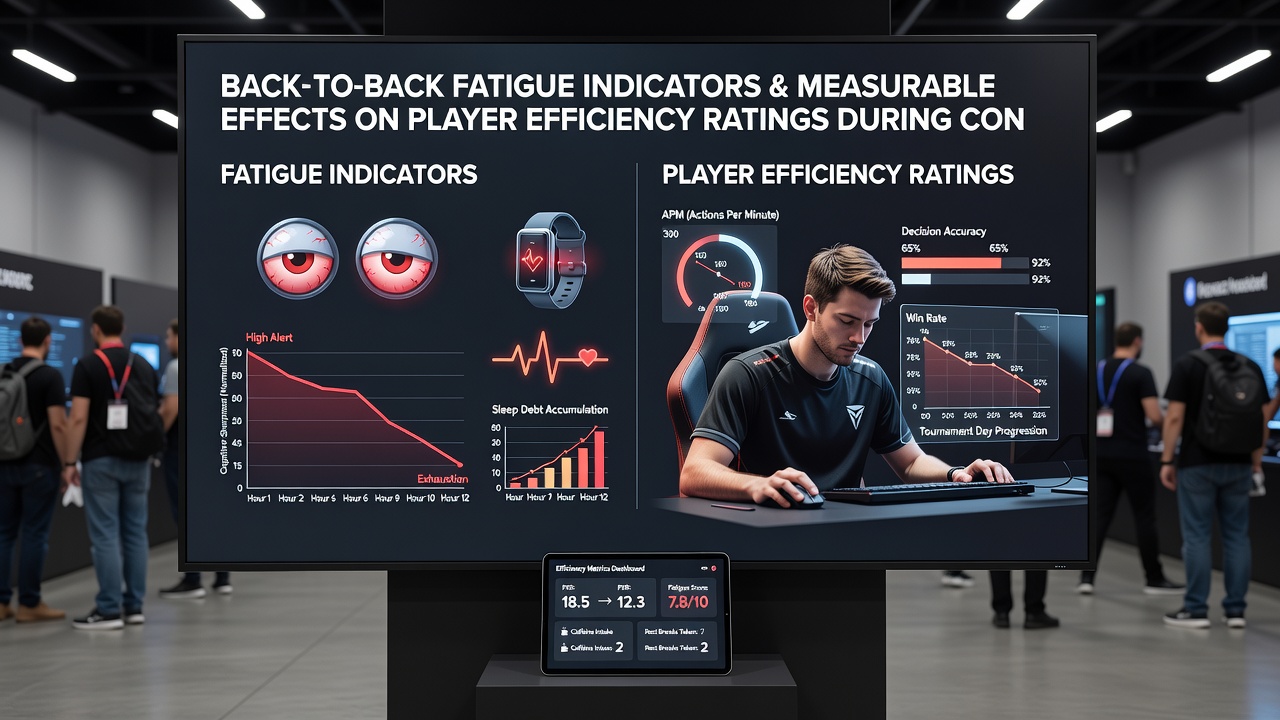
Coaches and analysts monitor several physical and statistical markers when teams face consecutive nights of competition, and studies compiled by league tracking systems highlight reduced sprint speeds, lower vertical leap outputs, and increased heart rate recovery times as primary signals. These indicators appear most clearly in players who exceed 30 minutes per game across multiple back-to-backs, where motion capture data reveals slower lateral movements and diminished explosive actions in the second contest of each set.
Heart rate variability readings collected from wearable devices further demonstrate elevated stress responses in athletes traveling between venues with limited rest windows, and teams that play three games in four nights record the sharpest spikes in these readings according to performance reports issued in advance of the 2026 schedule adjustments. Observers note that sleep duration logs from players in such stretches average under six hours per night, which compounds the physical toll and directly ties into observable efficiency declines.
Effects on Player Efficiency Ratings
Player Efficiency Rating calculations, which incorporate points, rebounds, assists, steals, blocks, and shooting percentages adjusted for pace and minutes, register consistent reductions when back-to-back demands intensify. League-wide figures from the past five seasons indicate an average PER drop of 2.8 points in second games of back-to-backs compared to standalone matchups, with perimeter players showing slightly larger variances than bigs due to higher demands on quick-twitch movements.
Advanced tracking reveals that shooting efficiency from beyond the arc falls by approximately 4.2 percentage points on the second night, while turnover rates climb as decision-making slows under accumulated fatigue. One study of condensed schedules during the 2024-2025 campaign found that teams with four or more back-to-backs in a 14-day window experienced roster-wide PER reductions that persisted even after a single rest day was inserted.
Seasonal Patterns and Schedule Density
The NBA schedule construction process places particular stress on certain months, and September 2026 preparations include efforts to redistribute high-density stretches following feedback from player health monitoring programs. Historical data indicates that December and January typically feature the highest concentration of back-to-backs, with teams averaging 12 to 15 such occurrences per season, and efficiency metrics reflect cumulative wear as the calendar progresses.
Travel distance adds another layer, since cross-country flights between consecutive games correlate with steeper efficiency drops than regional matchups. Researchers tracking these variables report that West Coast teams playing Eastern Conference opponents on back-to-backs see an additional 1.5-point PER reduction on average compared to intra-conference sequences.
Team Adjustments and Recovery Protocols
Front offices respond to these patterns by implementing targeted recovery strategies, including adjusted practice loads and rotation tweaks that limit starter minutes on the front end of back-to-backs. Data from multiple organizations shows that substituting bench units earlier in the first game preserves starter efficiency for the following night, with PER retention improving by up to 1.9 points when starter minutes stay below 28 in the opening contest.
Nutrition and hydration protocols also receive emphasis, since electrolyte balance and glycogen replenishment directly influence next-day performance outputs. Teams that integrate real-time biometric feedback into their game planning document measurable stabilization in efficiency ratings across condensed periods, particularly when rest opportunities are maximized between travel legs.
Broader League Implications
League executives review these efficiency trends when evaluating future calendar structures, and partnerships with research institutions have produced reports that quantify the relationship between schedule density and long-term player availability. The patterns observed in recent years suggest that targeted reductions in back-to-back frequency could maintain higher baseline efficiency levels, though implementation depends on broadcast commitments and arena availability constraints.
International comparisons provide additional context, as European basketball leagues with shorter travel requirements and fewer consecutive games show smaller efficiency fluctuations in similar player cohorts. Analysts examining these differences highlight how domestic scheduling density remains a unique variable in North American professional basketball.
Conclusion
Back-to-back fatigue indicators and their connections to player efficiency ratings continue to shape how teams prepare for and navigate condensed portions of the NBA calendar. Tracking systems, biometric data, and statistical analysis provide concrete evidence of performance shifts that teams address through rotation management and recovery planning, while league-wide schedule evaluations incorporate these findings to inform ongoing adjustments.